https://docs.google.com/forms/d/e/1FAIpQLSfFIeDq6mg117SAuGWmrUKP-b0xFTSr3YmqZ8s3Is9-WKpR1A/viewform
http://www.mathopolis.com/questions/index.php
Monday, 25 September 2017
Sunday, 24 September 2017
Saturday, 23 September 2017
Sunday, 17 September 2017
Saturday, 16 September 2017
Friday, 15 September 2017
Wednesday, 13 September 2017
Sketch trigonometric graph
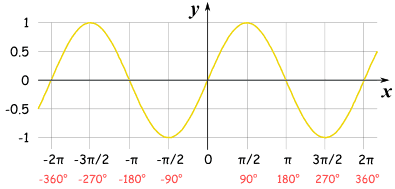
Plot of Sine

The Sine Function has this beautiful up-down curve (which repeats every 2π radians, or 360°).
It starts at 0, heads up to 1 by π/2 radians (90°) and then heads down to -1.
Plot of Cosine

Cosine is just like Sine, but it starts at 1 and heads down until π radians (180°) and then heads up again.
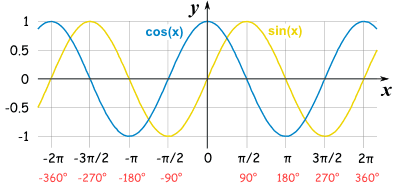
Plot of Sine and Cosine

In fact Sine and Cosine are like good friends: they follow each other, exactly "π/2" radians, or 90°, apart.
Plot of the Tangent Function

The Tangent function has a completely different shape ... it goes between negative and positive Infinity, crossing through 0 (every π radians, or 180°), as shown on this plot.
At π/2 radians, or 90° (and -π/2, 3π/2, etc) the function is officially undefined, because it could be positive Infinity or negative Infinity.
Inverse Sine, Cosine and Tangent
The Inverse Sine, Cosine and Tangent graphs are:

Inverse Sine

Inverse Cosine

Inverse Tangent
Mirror Images
Here is Cosine and Inverse Cosine plotted on the same graph:

Cosine and Inverse Cosine
They are mirror images (about the diagonal)!
The same is true for Sine and Inverse Sine and for Tangent and Inverse Tangent. Can you see this in the graphs above?
Tuesday, 12 September 2017
Empirical or Statistical Probability
Empirical probability is one of the objective probabilities. It is the relative frequency of the occurrence of an event and is determined by actual observation of an experiment. Consider an experiment, event A occurs "f" number of times if we repeat experiment n times.
Thenfn is known as frequency ratio. The particular limiting value from the frequency ratio as the number of repetitions becomes infinitely large is known as probability of the given event.
Probability is divided into two parts: theoretical probability and empirical probability. Sometimes empirical probability named as experimental probability. The probability of an event will always be a number between zero and one. An empirical probability of zero (0) means that the event never occurred and one (1) means that the event always occurred. In this section will study about empirical probability formula in detail.
Then
Probability is divided into two parts: theoretical probability and empirical probability. Sometimes empirical probability named as experimental probability. The probability of an event will always be a number between zero and one. An empirical probability of zero (0) means that the event never occurred and one (1) means that the event always occurred. In this section will study about empirical probability formula in detail.
Formula
Empirical probability formula = Probability of an event happening is the ratio of the time similar events happened in the past.
or Empirical probability =
Examples
Example 1: Eight coins are tossed. Below are frequencies of the number of tails are appeared.
| X | 0 | 1 | 2 | 3 | 4 | 5 | 6 | 7 | 8 |
| F | 2 | 15 | 29 | 57 | 70 | 59 | 20 | 10 | 8 |
Calculate the probability of occurred tails:
i) Equal to 5
ii) Less than 4
iii) More than 6
Solution:
Total number of heads occurred in an experiment = 2 + 15 + 29 + 57 + 70 + 59 + 20 + 10 + 8 = 270
i) P( occurred tails equal to 5).
From given table, number of required cases = 59
Therefore P( tails equal to 5) =
ii) P(occurred tails less than 4)
From given table, number of favorable cases = 2 + 15 + 29 + 57 = 103
Therefore P(tails less than 4) =
iii) P( more than 6 tails)
Total number of cases = 10 + 8 = 18
So P(tails more than 6) =
Example 2: The following are the marks obtained by 1200 students in a particular examination.
| Marks | 100-120 | 120-140 | 140-160 | 160-180 | 180-200 |
| No. of Students | 63 | 142 | 500 | 320 | 175 |
Find the probability that a student selected has marks :
i) Under 140
ii) Above 180
iii) Between 140 and 200
Solution:
Total marks obtained by students = 63 + 142 + 500 + 320 + 175 = 1200
i) Probability that a selected student get marks under 140.
There are 63 + 142 = 205 students.
ii) Probability that a selected student get marks above 180.
There are 175 students.
iii) Probability that a selected student get marks between 140 and 200.
There are 500 + 320 + 175 = 995 students.
Example 3: A coin is thrown 100 times out of which head appears 12 times. Find the experimental probability of getting the head?
Solution:
The coin is thrown 100 times. So total number of trails =100
Given head occurs 12 times. So the number of times the required event occurs = 12
Therefore probability of getting the event of head =
Subscribe to:
Comments (Atom)


