Expected Value of a Random Variable
Let X represent a discrete random variable with the probability distribution function P(X). Then the expected value of X denoted by E(X), or μ, is defined as:
E(X) = μ = Σ (xi × P(xi))
To calculate this, we multiply each possible value of the variable by its probability, then add the results.
Σ (xi × P(xi)) = { x1 × P(x1)} + { x2 × P(x2)} + { x3 × P(x3)} + ...
is also called the mean of the probability distribution.
Example 4
In Example 1 above, we had an experiment where we drew balls from an urn containing red and black balls. What is the expected number of red balls?
We already worked out the probabilities before:
| Possible Outcome | RR | RB | BR | BB |
| xi | ||||
| P(xi) |
This means that if we performed this experiment 1000 times, we would expect to get 800 red balls.
Variance of a Random Variable
Let X represent a discrete random variable with probability distribution function . The variance of X denoted by or σ2 is defined as:
V(X) = σ2 = Σ[{X − E(X)}2 × P(X) ]
Since μ = E(X), (or the average value), we could also write this as:
V(X) = σ2 = Σ[{X − μ}2 × P(X) ]
Another way of calculating the variance is:
V(X) = σ2 = E(X2) − [E(X)]2
Standard Deviation of the Probability Distribution
is called the standard deviation of the probability distribution. The standard deviation is a number which describes the spread of the distribution. Small standard deviation means small spread, large standard deviation means large spread.
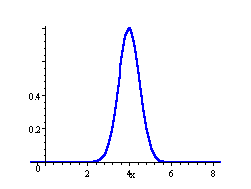
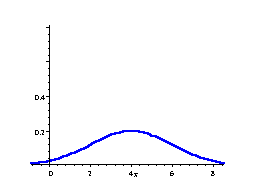
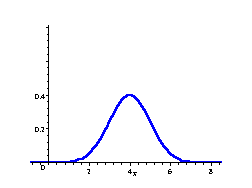
In the following 3 distributions, we have the same mean (μ = 4), but the standard deviation becomes bigger, meaning the spread of scores is greater.
Normal Curve
μ = 4, σ = 0.5
Normal Curve
μ = 4, σ = 1

Normal Curve
μ = 4, σ = 2
The area under each curve is .


No comments:
Post a Comment