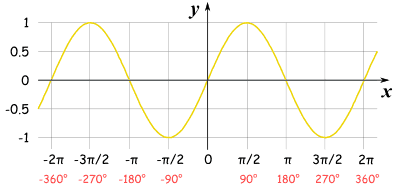
Plot of Sine

The Sine Function has this beautiful up-down curve (which repeats every 2π radians, or 360°).
It starts at 0, heads up to 1 by π/2 radians (90°) and then heads down to -1.
Plot of Cosine

Cosine is just like Sine, but it starts at 1 and heads down until π radians (180°) and then heads up again.
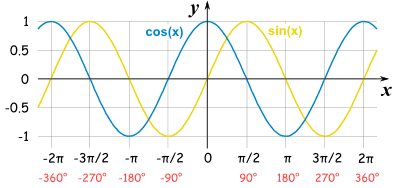
Plot of Sine and Cosine

In fact Sine and Cosine are like good friends: they follow each other, exactly "π/2" radians, or 90°, apart.
Plot of the Tangent Function

The Tangent function has a completely different shape ... it goes between negative and positive Infinity, crossing through 0 (every π radians, or 180°), as shown on this plot.
At π/2 radians, or 90° (and -π/2, 3π/2, etc) the function is officially undefined, because it could be positive Infinity or negative Infinity.

No comments:
Post a Comment